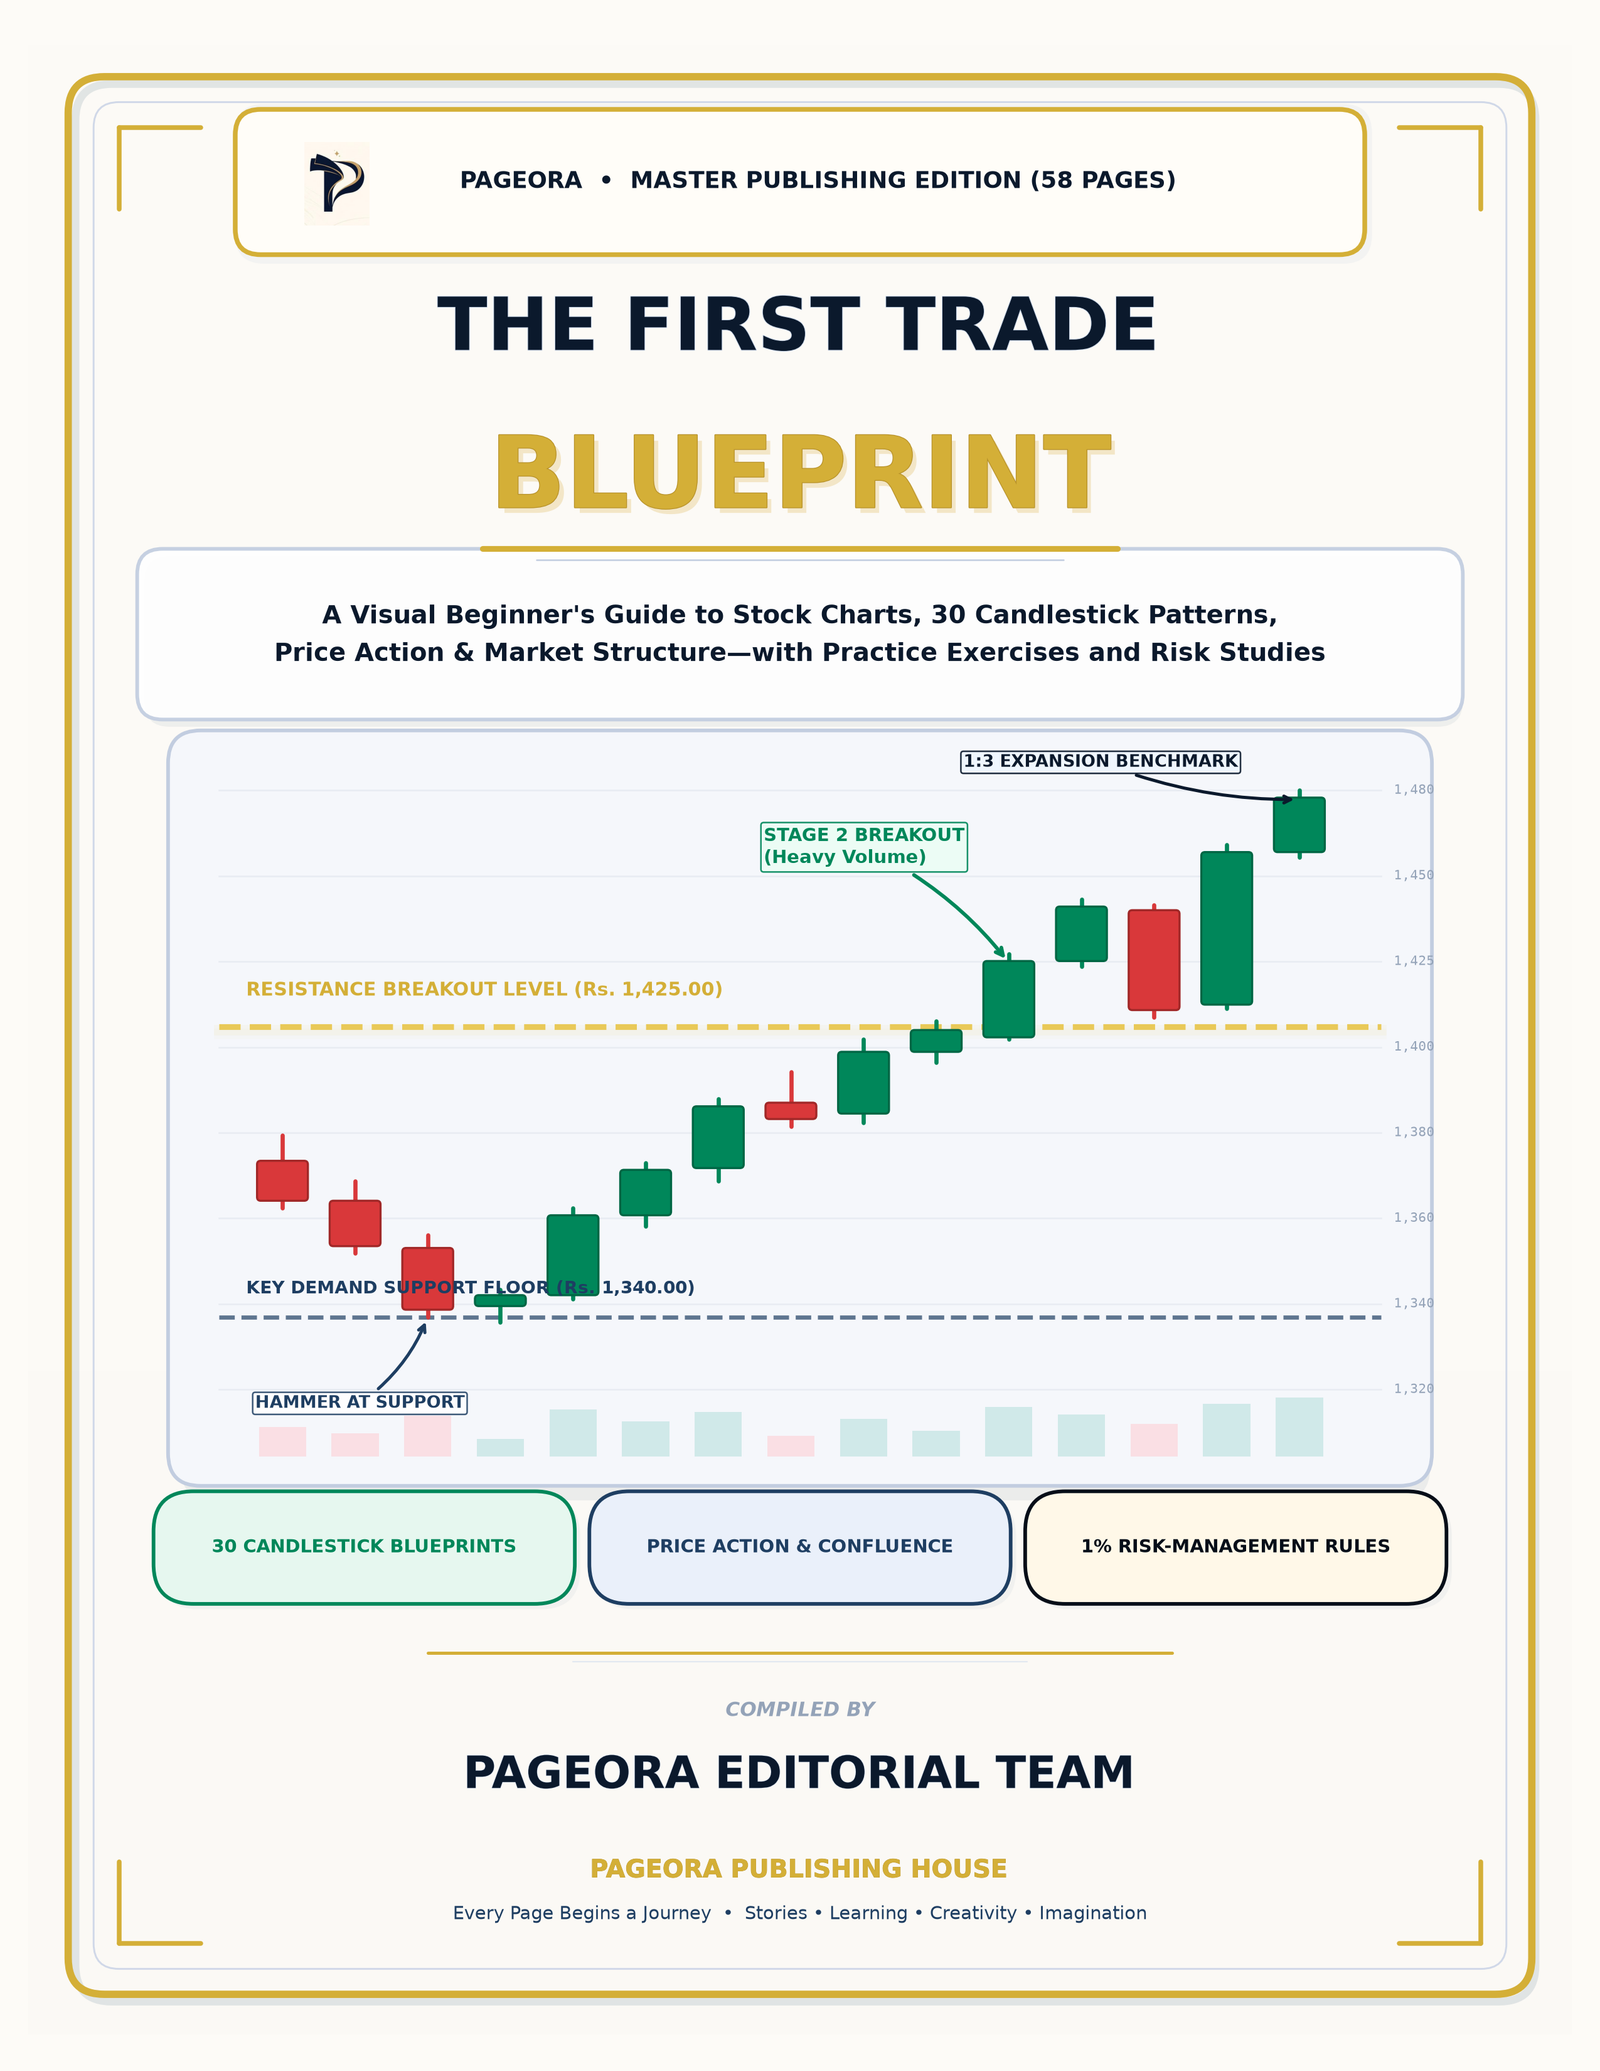
Master Stock Charts, 30 Candlestick Patterns, and Risk Management to Trade with Discipline and Confidence
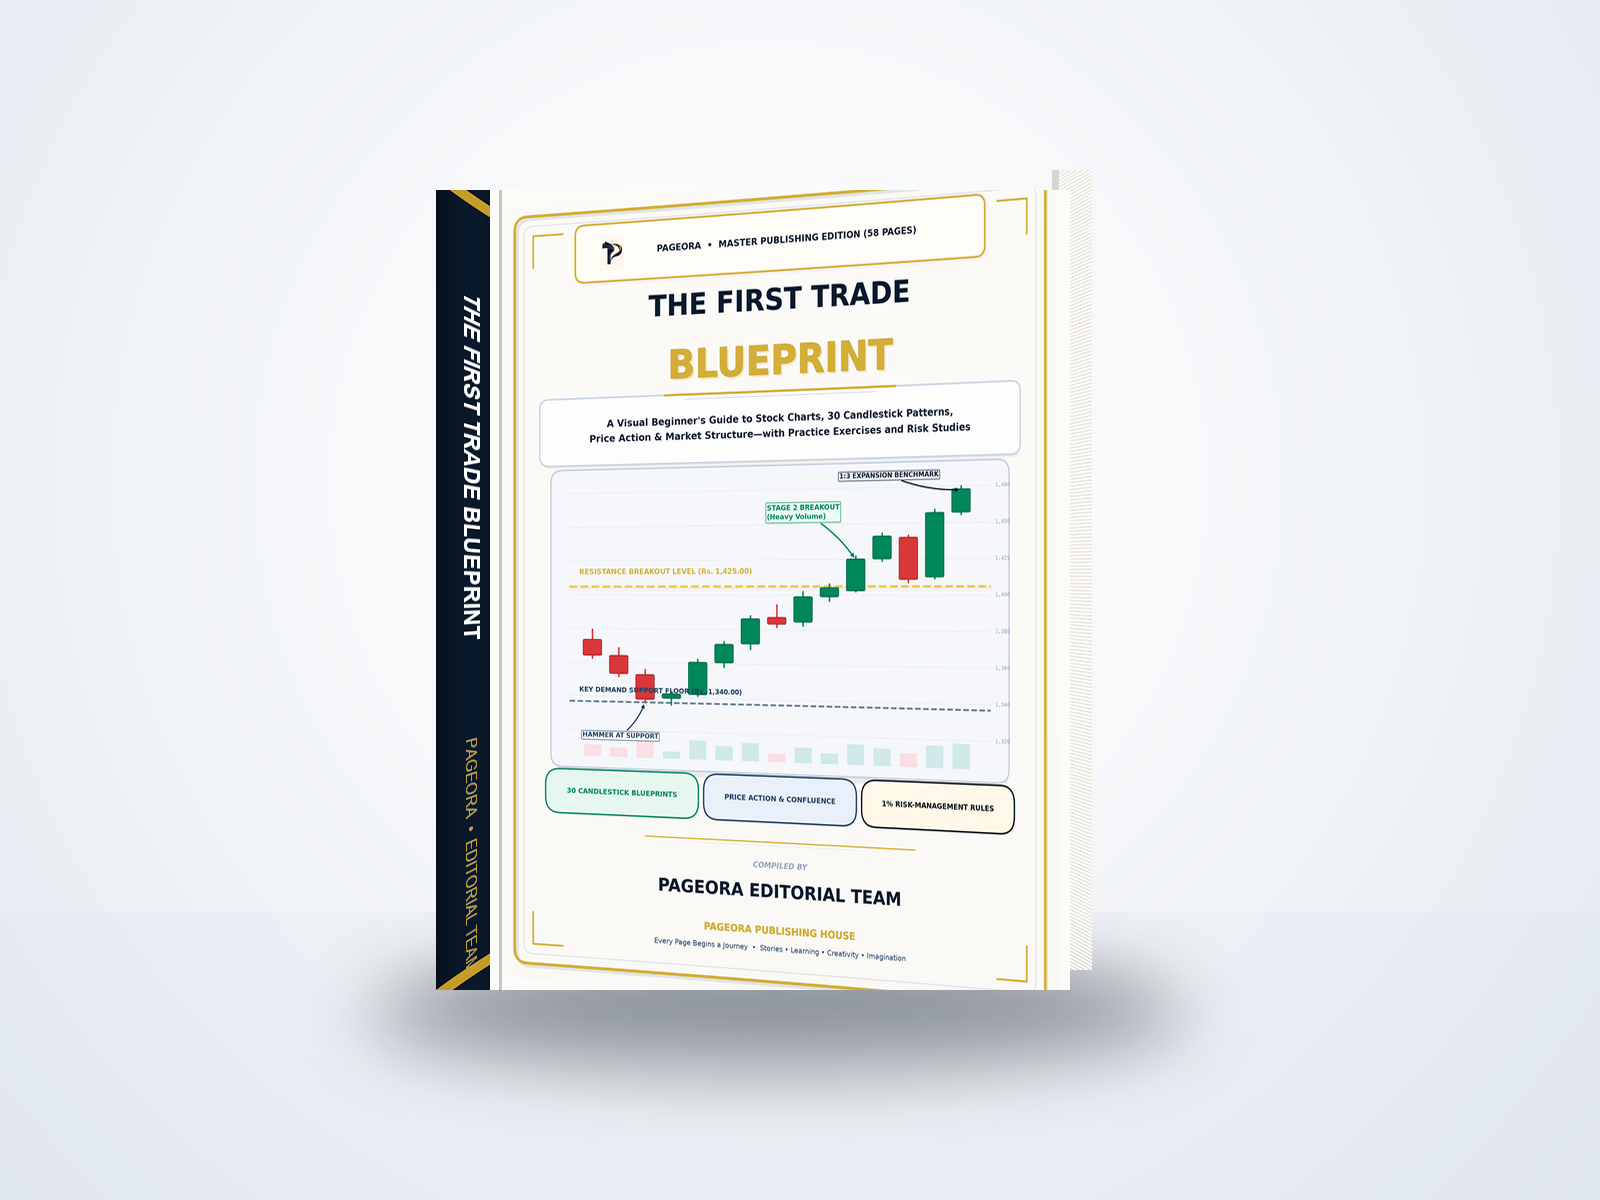
Access the complete 58-page Master Edition in high-resolution vector PDF.
Master Stock Charts, 30 Candlestick Patterns, and Risk Management to Trade with Discipline and Confidence.
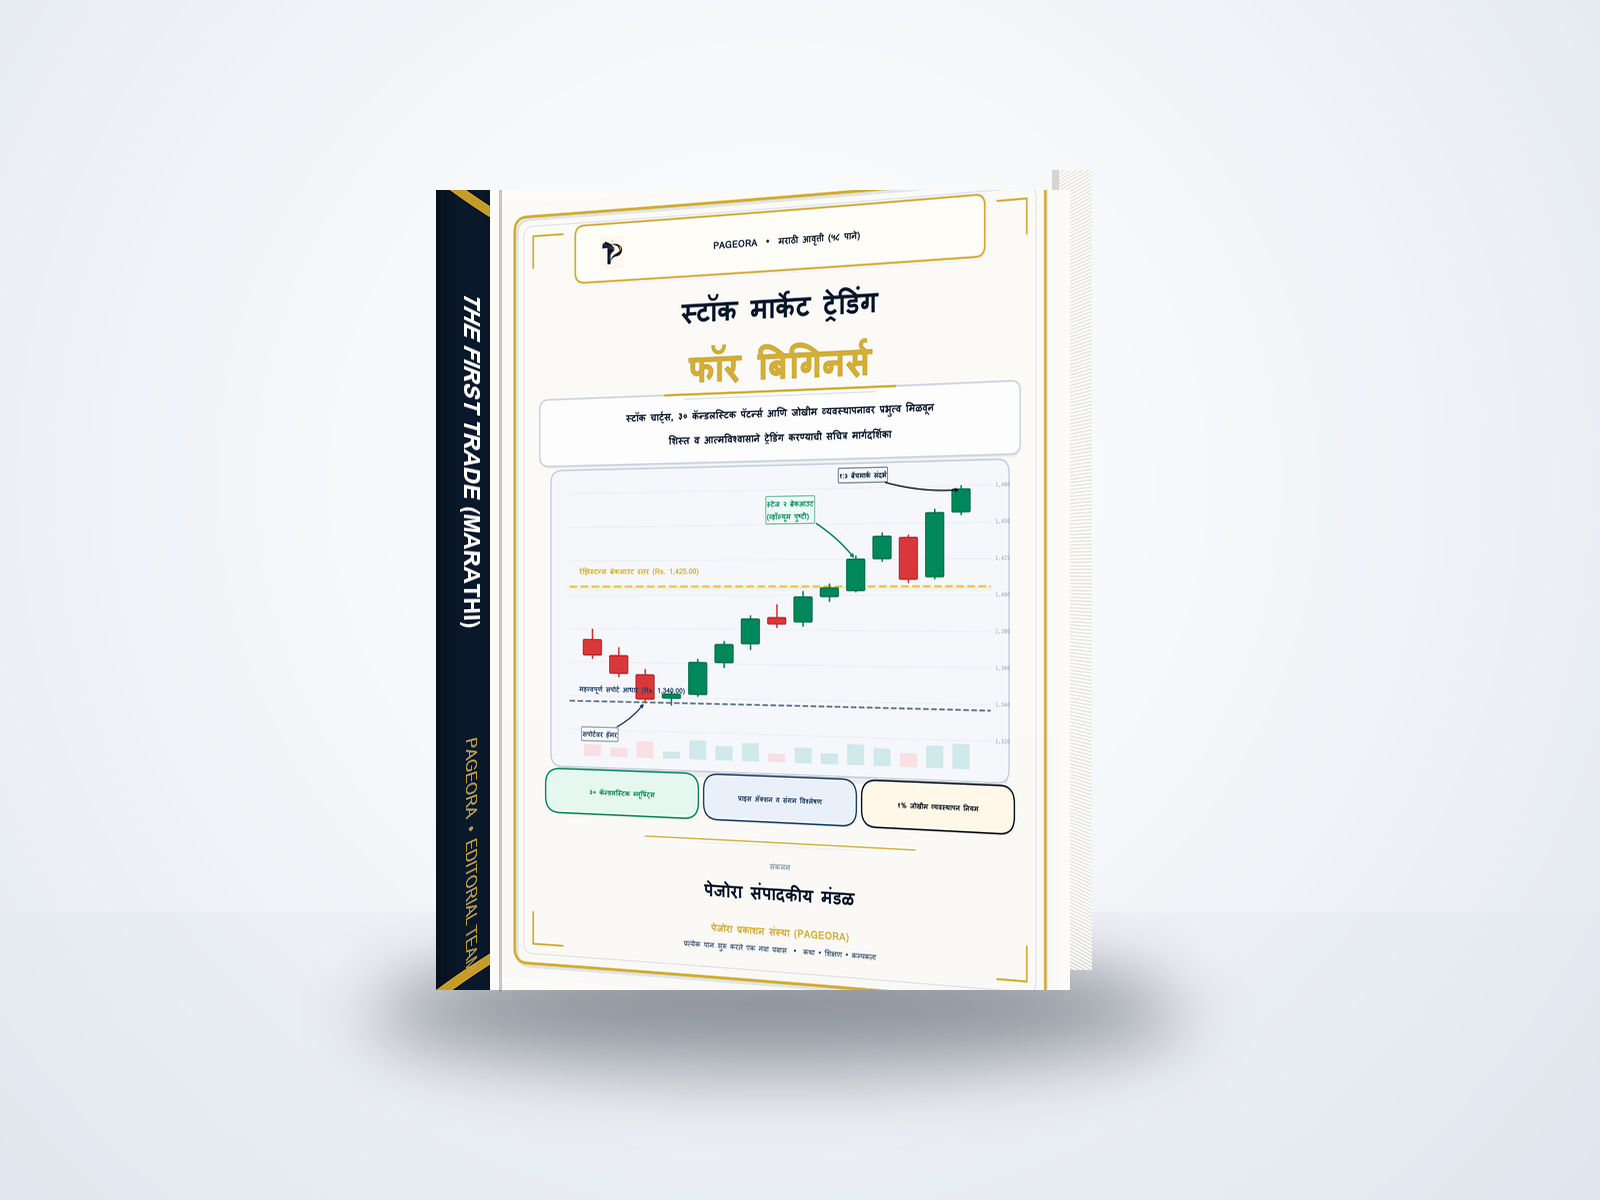
अस्खलित मराठीमध्ये ३० कॅन्डलस्टिक पॅटर्न्स, चार्ट ॲनाटॉमी आणि जोखीम व्यवस्थापनावर प्रभुत्व मिळवून शिस्त व आत्मविश्वासाने ट्रेडिंग करा.
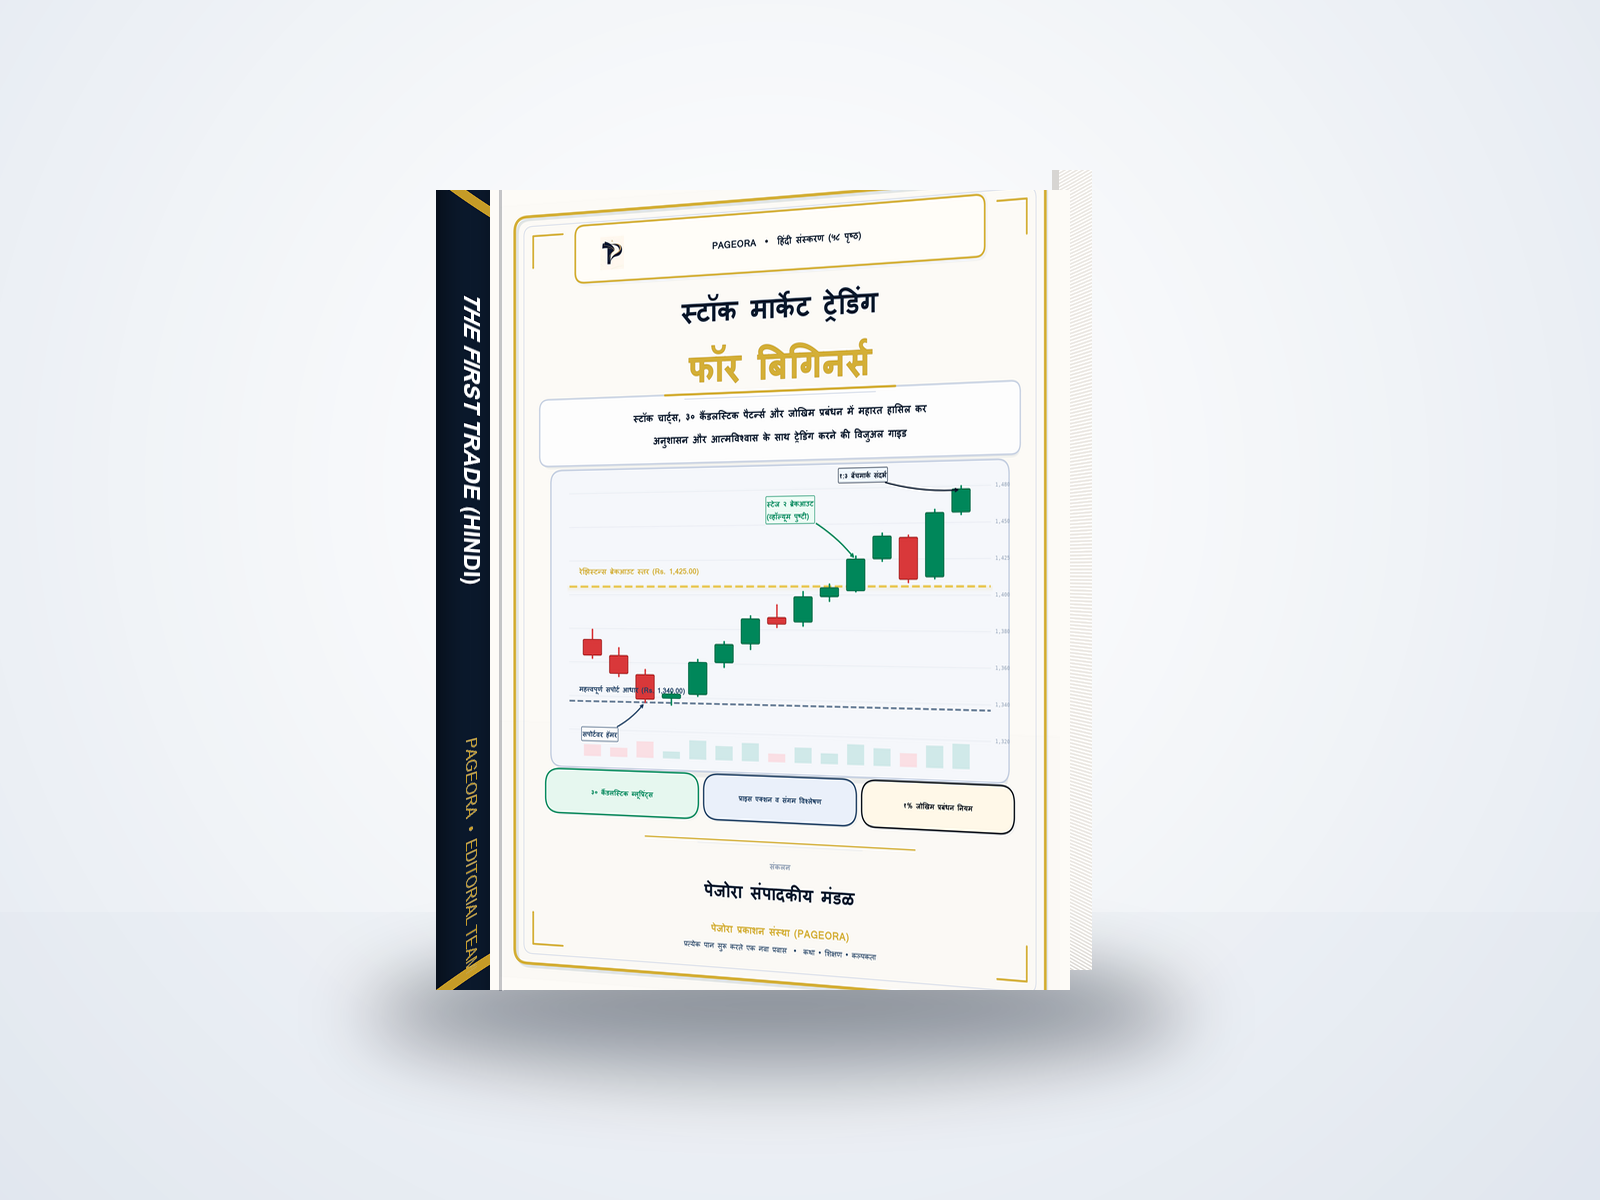
सरल हिंदी में ३० कैंडलस्टिक पैटर्न्स, चार्ट एनाटॉमी और जोखिम प्रबंधन में महारत हासिल कर अनुशासन और आत्मविश्वास के साथ ट्रेडिंग करें।
Never guess your position size again. Input your trading parameters below to enforce mathematical capital preservation in Indian Rupees (₹).
Quick reference guide to the 30 core candlestick formations, reversal signals, and trend patterns featured in the workbook.
Read the Indian market chart scenario below. Would you validate the technical setup or pass and wait for clearer conditions?
Reliance Industries (RELIANCE) has pulled back into a proven 3-month daily horizontal support floor around ₹2,480. A textbook Hammer candle prints with a lower wick 3x body height and volume 50% above average. The following morning candle opens and breaks above the Hammer high.
Every disciplined trader keeps these 10 core principles pinned right beside their trading station.
This publication and website are provided solely for educational and informational purposes. The content explains general concepts relating to technical analysis, candlestick patterns, market structure, chart interpretation, and risk management.
The author and publisher are not SEBI-registered Investment Advisers or Research Analysts. Nothing contained herein constitutes investment advice, financial advice, or a recommendation to buy, sell, or hold any security. Historical charts and mathematical examples do not guarantee future market outcomes. Financial markets involve substantial risk of loss.